This blog post is the last in a three-part series. You can read part I here and part II here.
How can institutions of higher education ensure financial stability in the face of uncertainty? The number of high school graduates is projected to decline nationally, and the college-going population is expected to undergo demographic changes. Though state funding has grown in recent years with support from the federal pandemic-related stimulus package, it is almost certain to become far scarcer and federal funding is at risk. In this environment, even if institutional or system finances are currently stable, governing boards are asking “what if” questions: What if state funding decreases or federal grants disappear? What would institutional finances look like with a substantial enrollment decline? What if health care costs continue to increase but revenue does not? Answering these questions based on past data combined with realistic forecasts allows leaders to plan strategically and avoid the trap of making financial decisions based on either optimism or fear.
In a project likely to be relevant to many other institutions and systems, the South Dakota Board of Regents (SDBOR) asked NCHEMS to simulate various scenarios for its six universities as a way of “stress testing” the system’s financial strength. NCHEMS created a customizable and responsive tool that allows SDBOR leaders to adjust a variety of enrollment, revenue, expense, and debt variables over a five-year period and see how institutional finances change as a result.
The resulting model defines institutional financial health according to three ratios: the operating ratio, primary reserve ratio, and viability ratio. We selected these ratios because they were already used in existing SDBOR financial reports, they are components of the well-known Composite Financial Index , and there are nationally standard targets for each of them.
Together, these three ratios provide a simple but insightful view into an institution’s overall financial health. For accreditation purposes, most institutions include the finances of their associated college foundations when they calculate these ratios. NCHEMS and SDBOR opted to exclude those foundations for a clearer look into each institution’s standalone finances for our modeling.
To build the model, NCHEMS compiled the individual components that comprise each of these ratios, primarily from the institutions’ audited financial statements. We then connected those revenue and expense variables to non-financial data, including the number of students and employees. For each financial and non-financial variable, we modeled trends over time for about five years in the past and five years into the future. We projected each variable and its resulting ratios based on current and past trends, and also built in the flexibility needed to simulate various ‘what-if’ scenarios.
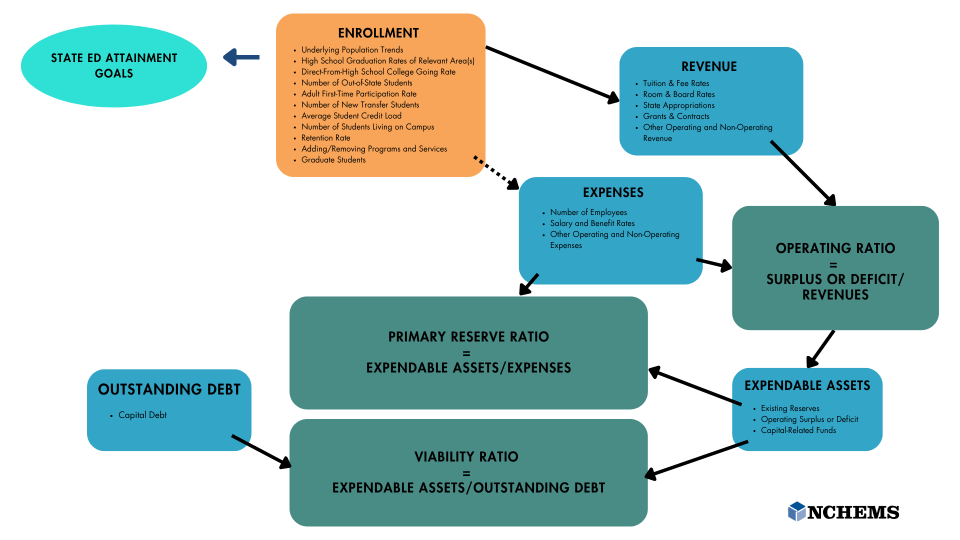
We created the following diagram to illustrate how enrollment, revenue, expense, asset, and debt variables impact each of the ratios.

Flowchart showing educational and financial metrics related to state educational attainment goals.
Enrollment is the primary driver of revenue within an institution’s control. Enrollment is also a precondition for institutions to fulfill their educational mission and contribute to larger educational attainment goals by offering a mix of programs that students and employers need. For those reasons, we emphasize detail and accuracy in the enrollment portion of the model. We were able to leverage NCHEMS’ long history of creating enrollment projections and incorporated data on many different enrollment drivers. These drivers include underlying population trends, college-going rates, dual credit enrollment, transfer rates, and retention rates, all of which are adjustable in the model’s scenario testing. We also included other revenue variables, such as trends in tuition and fee rates, state appropriations, grants and contracts, and other revenues.
Salaries and benefits are the primary components of institutional expenses. We identified trends in salary and benefits over time and separated these expenses by functional category (instruction, research, public service, etc.). Recognizing that some expenses are tied to enrollment and others are relatively fixed, regardless of student numbers, we adjusted projections for certain functional categories in line with estimated future enrollment and based others solely on past trends.
We found that looking at trends over time was essential. Ratios can change meaningfully from one year to the next, and a low ratio isn’t necessarily problematic if it is well-understood and temporary. For example, a one-year operating deficit may represent a smart strategic investment that the institution expects to increase enrollment over the long term.
The model is useful for both big-picture leadership and operational decision-making. Governing board members and others looking to understand general financial health trends can view the model’s simple line graphs of each ratio over time. Institutional staffers working on detailed budgeting can dig into how individual enrollment, revenue, or expense categories impact the institution’s finances over time, and test different scenarios for each.
The future is never entirely knowable, and many factors impacting institutional finances are not possible to predict. The modeling tool is not designed to be a clear window into the future. Instead, it’s a helpful planning tool that allows institutions to understand how various enrollment, revenue, and expense variables impact one another. This tool can help staffers identify the biggest risks to their institutions’ financial stability and get a sense of how vulnerable they are to changes of various magnitudes. Even more, system office leaders, governing board members, and other policy-setting actors can use the tool to gain a high-level understanding of each institution’s relative vulnerability to different conditions before they make decisions. In an environment of increasing uncertainty, the ability to understand those risks can help institutions ensure their financial resilience, allowing them to continue to meet their missions regardless of what the future holds.
Learn more about our work with SDBOR and see the rest of the blogs in this series.
Financial-Programmatic Analysis and Stress Testing for SDBOR Institutions